The expenses portion of my P&L report do not tally. I’ve added comparative columns to show June, July, Aug, etc. For example, without listing the detailed line item, the major sections show:
                  June         July          Aug
Staff         (3638.00)    (55,700.00)  (24,212.00)
Operating     (1989.27)    (2,550.07)    (2,594.08)
Marketing      (489.76)    (2,637.90)    (2,043.04)
R&D           (1694.88)    (169.00)         0.00

EXPENSES       47,413.32    (36,417.08)    32,952.85
This doesn’t make any sense. Why don’t they tally? And where does the dramatic swing from positive to negative come from?
You need to post a screen shot of the entire P&L report. Without seeing the structure of your chart of accounts, it’s impossible to understand what you’ve transcribed. Obscure organizational information if necessary.
Also post a screen shot of the setup screen for this P&L report, showing the column names and from/to dates.
Then use a screenshot of the report prior to PDF creation or take a screenshot of the PDF report itself so that it is a jpg/jpeg just like your screenshot of the P&L setup shown above.
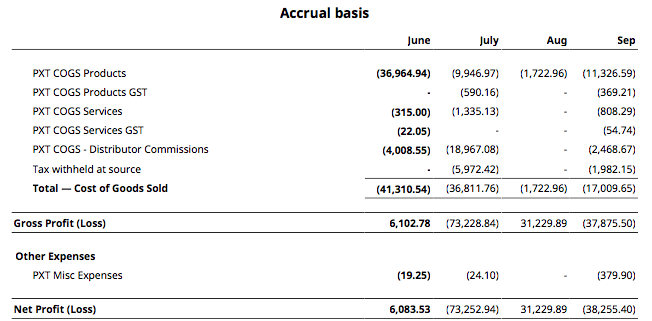
Your Expenses (7) is currently subtotalling Revenue & Expenses, that is why your expense figures are in brackets (negative income) and your Expense subtotal is showing a profit.
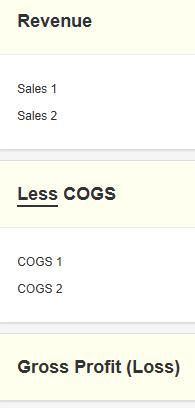
You need to group the Expenses separately from the Revenue - I will go and build the model and come back.
“Interim subtotals and final totals are useful in accounting displays. Add them with the New Total button. Totals calculate a running summation of all groups above them in the chart of accounts.”